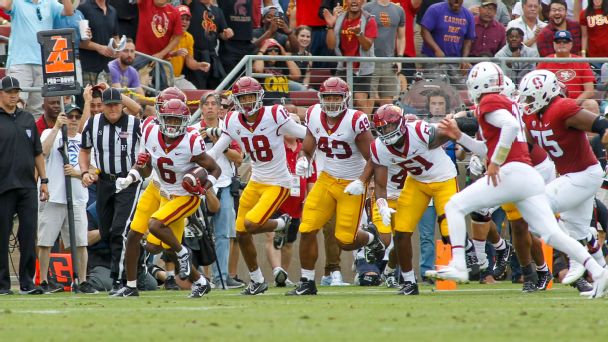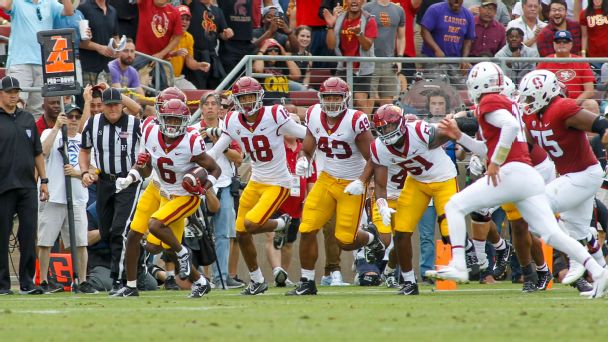
If you spent part of the 2022 college football season thinking, “USC can’t possibly keep getting away with this!!” then you should know this: Your hunches were as statistically sound as they were exasperated.
For much of last fall, the Trojans’ defense was good at one and only one thing: pouncing on the football just in the nick of time. They lacked in just about every other department — they were 93rd in scoring defense (29.2 points per game), 106th in total defense (423.9 yards per game) and a ghastly 124th in yards allowed per play (6.5!) — but they forced 28 turnovers, sixth-most in the FBS.
Every football coach in existence preaches the importance of turnovers and turnover margin. But while you can impact your own turnover margin to some degree with how well you teach ball security and ball pursuit, how aggressively you go after the opponent’s quarterback, how aggressive your own offense is, et cetera, there’s still a massive amount of fortune involved here. And USC’s fortune meter was turned all the way up.
In the first five USC games of 2022, there were nine fumbles, and the Trojans recovered all nine. Fumble recoveries revert to 50% over a long enough period of time, but USC got to an 11-1 record by having recovered 18 of 23 (78%). While a team typically intercepts about one pass to every four pass breakups, their regular-season ratio was 1-to-1.9, and their interceptions total was seven higher than national averages would suggest.
The INT ratio regressed to the mean late in the season, and the fumble recoveries will probably do the same soon enough. Luck and randomness play a massive role in the game of football — especially the version played by 18- to 22-year-olds — and as we slowly gear up for 2023, let’s take a look at who benefited the most from the bounce of the ol’ pointy football.
Fumble recovery rates
Indeed, over a large enough period of time, a team will recover about 50% of all fumbles. There’s a slight correlation between where a fumble occurs and which team is more likely to recover — the further downfield it is, the more likely a defender will pounce on it (primarily because there are usually more defenders in the near vicinity) — but even then the fates don’t change a ton. By simply looking at who recovered a particularly high or low percentage of loose balls, we are learning a lot about who benefited from fortune and who will be impacted by future regression toward the mean.
In 2022, seven of 131 FBS teams recovered at least 65% of all fumbles. They probably won’t do that again in 2023.
1. USC (74.1% fumble recovery rate, +6.5 recoveries over expected*)
2. East Carolina (72.7%, +5)
3. Northern Illinois (70.4%, +5.5)
4. Florida (70.0%, +6)
5. Duke (66.7%, +6)
6. Texas Tech (66.7%, +5.5)
7. Georgia Tech (65.5%, +4.5)
* “Recoveries over expected” compares how many fumbles a team recovered to how many it would have recovered pulling in exactly 50%.
Depending on how you do the math, a turnover is worth about 4-5 points in terms of field position value. So you can say that USC’s unsustainable fumble recovery rate was worth about 26-32 points in 2022. Those are points that Lincoln Riley’s Trojans will have to make up for with actually good defense this coming fall if they’re going to live up to what will almost certainly be top-10 expectations.
Really, there was only one team more fortunate in the fumbles department than USC: whoever was playing Arizona State. Eight teams recovered under 35% of all fumbles in 2022, but the Sun Devils were the only one under 20%. They were a disheveled mess in Herm Edwards’ final season in charge, going just 3-9 overall, but they were also an unlucky mess.
131. Arizona State (19.2% fumble recovery rate, -8 recoveries over expected)
130. Louisiana-Monroe (28.6%, -6)
129. Miami (30.3%, -6.5)
128. Charlotte (31.6%, -3.5)
127. Central Michigan (32.4%, -6.5)
126. TCU (33.3%, -5)
125. Texas (33.3%, -3)
124. Houston (34.2%, -6)
Obviously poor bounces can affect a game in a lot of ways, but the five teams at the bottom of this list averaged a No. 108 ranking in field position margin. That probably isn’t coincidental.
The INT-to-breakup ratio
When it comes to understanding good or bad fortune, fumble recoveries are pretty straightforward. We’ve all seen instances in which a player from our team looks like he’s going to pounce on a loose ball, only to have it suddenly bounce between his legs and into the open arms of an opponent. The “luck” in “fumbles luck” is easy to grasp. The other kind of fortune in the turnovers department is a bit easier to miss.
On average, about 21% of all passes defensed (interceptions and breakups) become interceptions. This ratio can shift slightly based on whether you play man or zone defense — zone, for instance, tends to produce fewer total passes defensed (since defenders aren’t as close to receivers) but a higher proportion of interceptions (since more defenders are facing the ball). As with fumble recoveries, however, the difference there isn’t dramatic, and simply looking at who had the highest and lowest ratios of INTs to PBUs can tell us quite a bit.
Five teams held onto at least 30% of all passes defensed. Yes, USC was among them.
1. Southern Miss (32.7% of passes defensed were INTs, +6.8 INTs over expected)
2. UConn (32.5%, +5.1)
3. Notre Dame (32.3%, +3.9)
4. USC (30.6%, +6.8)
5. Western Kentucky (30.2%, +6.6)
Five teams on this list ended up with at least six more interceptions than national averages would have suggested: Illinois (+6.9), Southern Miss (+6.8), USC (+6.8), WKU (+6.6) and NC State (+6.4).
The Illinois secondary was special in many ways. Defensive coordinator Ryan Walters, now Purdue‘s head coach, was able to play more man coverage than anyone — according to Sports Info Solutions. They did so 73.8% of the time on opponents’ dropbacks, first in FBS and nearly double the national average of 37.4% — thanks to the unique skills of corners Devon Witherspoon and Tahveon Nicholson and slot corner Jartavius Martin and the incredible ball-hawking of safeties Sydney Brown and Kendall Smith.
Of those five, only Nicholson returns. Walters is gone, too. That’s a massive hit right there, but when you factor in Brown and Smith’s INT ratio — 11 INTs to 10 breakups — one can see Illinois’ secondary getting both less talented and less fortunate in 2023.
At least Illinois’ defense was good, though. During its 11-1 start, USC’s otherwise miserable D produced 19 interceptions to 37 breakups; in season-ending losses to Utah in the Pac-12 championship game and to Tulane in the Cotton Bowl, the Trojans broke up eight passes with zero picks, and despite still recovering five of seven total fumbles, they had no other way of making stops. They allowed 93 points and 1,072 yards (8.9 per play).
Just as some teams held onto picks, others did not. Here are the five teams that picked off 10% or fewer of their passes defensed.
131. Michigan State (6.3% of passes defensed were INTs, -4.3 INTs over expected)
130. Central Michigan (7.4% -6.6)
129. Virginia Tech (8.5%, -5.2)
128. West Virginia (9.8%, -4.1)
127. Texas A&M (10.0%, -3.9)
Four teams ended up with 5.5 fewer INTs than expected: Fresno State (-6.7), Central Michigan (-6.6), Wake Forest (-6.0) and … Alabama (-5.6). Even the best and most talented teams drop a few too many picks sometimes.
Some teams also throw particularly catchable interceptions. Every offense ends up with a number of passes defensed, but here are the eight teams that saw opponents pick off at least 30% of PDs. This is a list you don’t want to be on.
1. Oregon State (36.1% of passes defensed were INTs, +6.1 INTs over expected)
2. Navy (35.3%, +2.7)
3. Rutgers (34.2%, +5.7)
4. Utah State (33.3%, +7.2)
5. Troy (33.3%, +5.5)
6. South Carolina (33.3%, +5.1)
7. UMass (31.0%, +4.9)
8. Boston College (30.4%, +5.2)
That Oregon State enjoyed its first 10-win season in 16 years despite having both poor and unlucky quarterback play is a mind-boggling achievement. But the Beavers were close to doing even more; in their loss to turnover magicians USC, they had four passes intercepted to only three broken up.
Upon whom did the god of dropped interceptions smile the most? Here are the five offenses that saw under 10% of their defensed passes intercepted.
131. Tennessee (6.7% of passes defensed were INTs, -3.8 INTs over expected)
130. FAU (7.1%, -5.1)
129. Texas A&M (8.2%, -5.4)
128. Duke (8.3%, -6.5)
127. East Carolina (8.8%, -6.0)
Tennessee’s presence here is a bit misleading — the Vols had only 30 total passes defensed in 2022, seventh-fewest in the country (and fourth-fewest among non-service academies). They should have thrown 3.8 more interceptions than they did, and that’s certainly something in mind as the QB reins get passed from Hendon Hooker to the more historically mistake-prone Joe Milton III, but plenty of teams were higher. ECU and Duke were among five teams to have thrown at least six fewer INTs than expected. The others: Buffalo (-7.0), WKU (-6.3) and Old Dominion (-6.3).
Perhaps the most surprising name above: Texas A&M. For as poor as the Aggies’ quarterback play was in 2022 — and I would certainly suggest that “78th in Total QBR, 79th in yards per dropback and 106th in completion rate” qualifies as poor — it could have been worse. A&M quarterbacks threw only six interceptions, but that total evidently should have been closer to 11-12.
2022 turnovers luck
We’ve done the math on the fortune and misfortune behind both fumbles and interceptions, which means we can compile an overall list of teams and the turnovers luck they enjoyed or endured in 2022. Here’s every team in FBS, listed with their fumbles luck (fumble recoveries over expected), interceptions luck (defensive INTs over expected, plus offensive INTs under expected), total turnovers luck and a points-per-game figure based on the total turnovers luck (using 4.5 points per turnover).
Could we use “randomness” instead of “luck”? Absolutely. But luck sounds more provocative, doesn’t it?
USC enjoyed its first 11-win season in five years, ECU its first eight-win season in eight. Buffalo improved from 4-8 to 7-6, Duke shocked the world by leaping from 3-9 to 9-4 and Kansas State won its first Big 12 title in a decade.
WKU aside, most of the teams atop the turnovers luck list were pleasant surprises and/or major improvement stories. (Others, like Georgia State and Georgia Tech, evidently could have had even worse campaigns than they actually did). Meanwhile, many of the teams at the bottom of the list — Houston, CMU, Arizona State, Virginia Tech, Boston College, Colorado State, West Virginia — were regarded as disappointing. Execution obviously had a huge part to play for all of these teams, lucky and unlucky. But the turnovers fairy had a role as well, and she will likely smile or frown on an entirely different set of teams in 2023.


