By using this site, you agree to the Privacy Policy and Terms of Use.
Accept
BigPaulSportsBigPaulSports
Notification Show More
Latest News
Cam Ward has a message for NFL teams: 'If you don't draft me, that's your fault'
Cam Ward has a message for NFL teams: ‘If you don’t draft me, that’s your fault’
Game Analysis NFL
Lil Wayne defends Jordan Love, talks Lakers' championship on 'First Things First'
Lil Wayne defends Jordan Love, talks Lakers’ championship on ‘First Things First’
Game Analysis
5 ways to fix NBA All-Star Weekend after widely panned 2025 event
Game Analysis
Can Lakers make a title run as sixth-best odds to win NBA Finals? | First Things First
Game Analysis
Bucky Brooks’ Top 5 Super Bowl contenders sparks debate | First Things First
Game Analysis NFL
Aa
  • Big Paul Sports
  • Services
  • Game Analysis
  • Free Picks
  • Premium Content
  • Registration
  • Member Login
Reading: Post-spring SP+ rankings for all 133 teams, plus the Colorado conundrum and more takeaways
Share
Aa
BigPaulSportsBigPaulSports
  • Big Paul Sports
  • Services
  • Game Analysis
  • Free Picks
  • Premium Content
  • Registration
  • Member Login
Search
  • Big Paul Sports
  • Services
  • Game Analysis
  • Free Picks
  • Premium Content
  • Registration
  • Member Login
Have an existing account? Sign In
Follow US
BigPaulSports > Blog > NCAA > Post-spring SP+ rankings for all 133 teams, plus the Colorado conundrum and more takeaways
NCAASports News

Post-spring SP+ rankings for all 133 teams, plus the Colorado conundrum and more takeaways

BigP
Last updated: 2023/05/25 at 1:32 PM
BigP Published May 25, 2023
Share
Post-spring SP+ rankings for all 133 teams, plus the Colorado conundrum and more takeaways
SHARE
  • Bill Connelly, ESPN Staff WriterMay 18, 2023, 08:00 AM ET

    Contents
    Post-spring college football SP+ rankingsChanges near the topGeorgia and the transfer gapEditor’s PicksUpdated returning production2023 returning production rankingsThe Power 5 experience advantage
    Close

      Bill Connelly is a staff writer for ESPN.com.

The transfer portal is slowing down, media days are around the corner and with all due respect to Week 0 — I love it dearly, just as much as all the other weeks — we’re officially 100 days from Sept. 2, the first real Saturday of the 2023 college football season.

It seems like a pretty good time, then, to get up to date on the numbers. Since February’s initial 2023 SP+ release, we’ve seen a number of transfers and big moves, and I’ve been able to better update returning production figures to account for teams’ official roster releases. (Not many had released full rosters in early February.) We haven’t seen much movement at the very top of the rankings, but there’s plenty to talk about.

A quick reminder: Preseason projections are based on three factors.

1. Returning production. The returning production numbers are based on rosters I have updated as much as possible to account for transfers and attrition. The combination of last year’s SP+ ratings and adjustments based on returning production makes up more than half the projections formula.

2. Recent recruiting. This piece informs us of the caliber of a team’s potential replacements (and/or new stars) in the lineup. It is determined by the past few years of recruiting rankings in diminishing order (meaning the most recent class carries the most weight). This is also impacted by the recruiting rankings of incoming transfers, an acknowledgment that the art of roster management is now heavily dictated by the transfer portal. This piece makes up about one-third of the projections formula.

3. Recent history. Using a sliver of information from previous seasons (two to four years ago) gives us a good measure of overall program health. It stands to reason that a team that has played well for one year is less likely to duplicate that effort than a team that has been good for years on end (and vice versa), right?

(One other reminder: SP+ is a tempo- and opponent-adjusted measure of college football efficiency. It is a predictive measure of the most sustainable and predictable aspects of football, not a résumé ranking, and along those same lines, these projections aren’t intended to be a guess at what the AP Top 25 will look like at the end of the year. These are simply early offseason power rankings based on the information we have been able to gather to date.)

Here are the full, updated rankings:

Post-spring college football SP+ rankings

Team SP+ Off. SP+ Def. SP+
1. Georgia 29.9 41.9 (9) 11.9 (3)
2. Ohio St. 29.6 46.4 (2) 16.7 (13)
3. Michigan 29.2 42.0 (7) 12.9 (4)
4. Alabama 27.9 44.2 (5) 16.3 (10)
5. LSU 25.2 41.6 (10) 16.4 (12)
6. Tennessee 23.9 45.5 (3) 21.6 (31)
7. USC 23.6 46.4 (1) 22.8 (39)
8. Penn St. 23.5 37.5 (22) 14.0 (6)
9. Texas 23.3 40.4 (11) 17.1 (16)
10. Florida St. 21.6 38.4 (19) 16.8 (14)
11. Oregon 21.5 44.5 (4) 23.0 (42)
12. Clemson 21.3 37.6 (21) 16.3 (11)
13. Oklahoma 19.7 42.1 (6) 22.4 (37)
14. Utah 19.4 40.0 (13) 20.6 (26)
15. Notre Dame 19.3 36.3 (26) 17.0 (15)
16. Texas A&M 18.8 30.7 (44) 11.9 (2)
17. Washington 18.3 42.0 (8) 23.7 (48)
18. Ole Miss 17.5 39.0 (14) 21.4 (30)
19. Wisconsin 15.8 31.4 (41) 15.6 (7)
20. TCU 15.8 38.7 (16) 23.0 (41)
21. Florida 14.8 37.4 (23) 22.6 (38)
22. Kentucky 14.5 28.1 (59) 13.7 (5)
23. Kansas St. 14.3 36.1 (27) 21.8 (34)
24. UCLA 14.3 40.0 (12) 25.7 (60)
25. Miss. St. 14.1 35.8 (29) 21.7 (32)
26. Arkansas 13.8 38.6 (17) 24.8 (51)
27. Auburn 13.7 33.5 (35) 19.8 (23)
28. N. Carolina 13.5 38.8 (15) 25.3 (55)
29. Iowa 13.2 23.2 (81) 10.1 (1)
30. Oregon St. 12.8 34.1 (34) 21.3 (29)
31. Minnesota 12.0 27.7 (63) 15.7 (9)
32. Baylor 11.9 35.5 (30) 23.6 (47)
33. S. Carolina 11.6 37.9 (20) 26.3 (64)
34. Missouri 11.1 29.4 (52) 18.3 (17)
35. UCF 11.0 33.3 (37) 22.3 (36)
36. Louisville 11.0 29.9 (50) 18.9 (20)
37. Miami 10.9 30.3 (47) 19.3 (22)
38. Texas Tech 10.8 38.5 (18) 27.7 (69)
39. Oklahoma St. 10.5 36.0 (28) 25.5 (59)
40. Maryland 9.0 30.0 (49) 21.1 (27)
41. Pittsburgh 8.7 32.7 (40) 24.0 (49)
42. Michigan St. 7.9 28.5 (56) 20.6 (25)
43. NC St. 7.5 26.8 (67) 19.3 (21)
44. Illinois 7.0 22.7 (86) 15.7 (8)
45. Iowa St. 6.8 25.3 (74) 18.5 (18)
46. Cincinnati 6.4 25.2 (76) 18.9 (19)
47. Tulane 5.8 34.1 (33) 28.3 (72)
48. Purdue 5.7 30.6 (45) 24.9 (52)
49. Nebraska 5.3 27.3 (65) 22.0 (35)
50. SMU 5.1 37.4 (24) 32.3 (100)
51. Wake Forest 4.8 33.3 (38) 28.5 (73)
52. Syracuse 4.7 27.7 (62) 23.0 (43)
53. Houston 4.3 37.1 (25) 32.8 (102)
54. California 4.0 26.9 (66) 22.9 (40)
55. Duke 4.0 29.7 (51) 25.8 (61)
56. W. Virginia 3.0 31.1 (43) 28.1 (71)
57. UTSA 2.9 33.2 (39) 30.3 (85)
58. Wash. St. 2.3 27.4 (64) 25.0 (54)
59. Memphis 2.0 33.4 (36) 31.4 (94)
60. BYU 1.8 31.2 (42) 29.5 (80)
61. Kansas 0.9 34.6 (31) 33.7 (106)
62. Boise St. 0.6 26.1 (70) 25.5 (57)
63. Arizona St. 0.2 30.4 (46) 30.2 (84)
64. Troy -0.6 22.4 (88) 23.0 (44)
65. Va. Tech -1.4 22.1 (90) 23.5 (46)
66. Marshall -2.5 20.6 (96) 23.1 (45)
67. Ga. Tech -2.7 22.3 (89) 25.0 (53)
68. Fresno St. -2.8 22.7 (85) 25.5 (58)
69. Vanderbilt -3.1 29.2 (53) 32.3 (99)
70. Arizona -3.1 34.6 (32) 37.6 (123)
71. Indiana -3.4 27.8 (61) 31.2 (92)
72. S. Alabama -3.6 24.0 (79) 27.6 (67)
73. Rutgers -4.0 20.8 (95) 24.8 (50)
74. Boston Coll. -4.2 22.0 (91) 26.2 (63)
75. Coastal Caro. -4.6 28.6 (55) 33.2 (105)
76. Toledo -4.7 25.7 (72) 30.4 (86)
77. App. St. -4.7 28.3 (57) 33.0 (103)
78. Louisiana -4.8 24.7 (77) 29.6 (81)
79. Virginia -5.3 14.7 (124) 19.9 (24)
80. JMU -5.4 25.2 (75) 30.6 (87)
81. Air Force -6.1 15.6 (122) 21.7 (33)
82. FAU -6.5 23.4 (80) 29.8 (82)
83. Northwestern -6.7 14.6 (126) 21.3 (28)
84. WKU -6.9 28.7 (54) 35.6 (117)
85. SDSU -7.3 18.0 (110) 25.3 (56)
86. N. Texas -7.7 30.2 (48) 37.9 (125)
87. Liberty -7.8 24.1 (78) 31.9 (96)
88. ECU -8.2 19.4 (103) 27.6 (68)
89. Georgia St. -9.5 26.7 (68) 36.3 (120)
90. So. Miss -9.6 21.4 (93) 31.1 (91)
91. Army -9.7 21.0 (94) 30.7 (88)
92. Wyoming -10.0 16.2 (121) 26.2 (62)
93. Ohio -10.0 25.9 (71) 35.9 (118)
94. UAB -10.1 18.4 (107) 28.5 (74)
95. Stanford -10.1 17.4 (115) 27.5 (66)
96. Ga. Southern -10.5 27.9 (60) 38.5 (129)
97. SJSU -10.8 20.6 (97) 31.3 (93)
98. Navy -11.1 17.6 (113) 28.8 (78)
99. Temple -11.2 19.6 (102) 30.8 (89)
100. Tulsa -11.5 26.7 (69) 38.2 (127)
101. Miami-OH -11.8 15.2 (123) 27.0 (65)
102. Buffalo -11.9 22.9 (83) 34.9 (113)
103. Colorado -12.6 22.8 (84) 35.4 (115)
104. MTSU -12.8 19.3 (104) 32.2 (98)
105. EMU -13.1 20.0 (100) 33.1 (104)
106. USF -13.5 25.5 (73) 39.0 (130)
107. UNLV -13.8 20.4 (98) 34.2 (109)
108. La. Tech -13.8 28.1 (58) 42.0 (133)
109. CMU -13.9 16.3 (120) 30.1 (83)
110. Arkansas St. -14.6 20.2 (99) 34.9 (112)
111. Ball St. -14.6 17.3 (116) 31.9 (97)
112. Rice -14.9 22.5 (87) 37.4 (122)
113. Nevada -15.4 16.3 (119) 31.7 (95)
114. NIU -16.1 23.0 (82) 39.1 (131)
115. UConn -16.2 14.6 (125) 30.8 (90)
116. Utah St. -16.2 18.0 (111) 34.2 (110)
117. UTEP -16.3 18.2 (108) 34.5 (111)
118. Colorado St. -16.4 12.3 (127) 28.7 (77)
119. ODU -16.4 12.2 (128) 28.6 (76)
120. WMU -17.1 16.8 (118) 33.9 (108)
121. Sam Houston -17.4 10.7 (131) 28.1 (70)
122. NMSU -17.5 17.9 (112) 35.4 (116)
123. J’ville St. -18.2 21.5 (92) 39.7 (132)
124. Hawaii -18.4 17.6 (114) 35.9 (119)
125. BGSU -18.4 19.8 (101) 38.3 (128)
126. Charlotte -18.5 16.9 (117) 35.3 (114)
127. FIU -18.5 18.7 (105) 37.2 (121)
128. Texas St. -19.4 9.2 (132) 28.6 (75)
129. UL-Monroe -19.6 18.6 (106) 38.1 (126)
130. Akron -19.6 18.1 (109) 37.7 (124)
131. UMass -21.7 11.0 (130) 32.7 (101)
132. New Mexico -21.7 12.2 (129) 33.9 (107)
133. Kent St. -23.0 6.2 (133) 29.1 (79)

Changes near the top

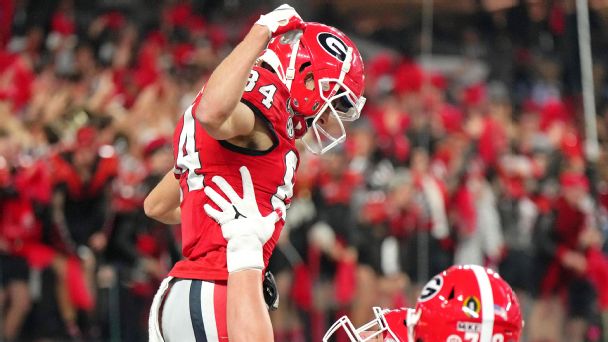
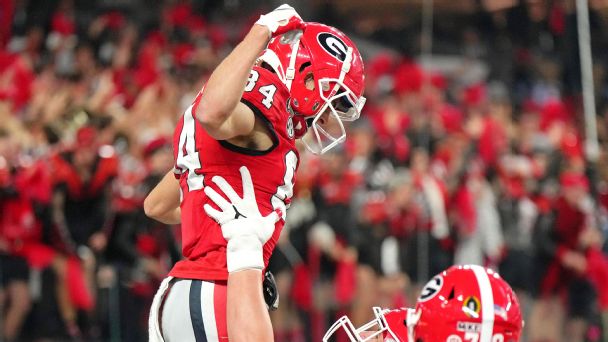
The top four teams remain the same as they were in February, and in the same order. As other teams have added useful transfers, Georgia‘s overall advantage on the field has diminished a bit (we’ll talk about that below), but the Dawgs still begin 2023 as favorites to defend their back-to-back national titles.

There were a few interesting moves near the top, though.

LSU up two spots from seventh to fifth: Brian Kelly has monitored the transfer portal closely since the first day he arrived in Baton Rouge, and by this point in the 2023 cycle, he has added transfers with power-conference starting experience at running back (Notre Dame‘s Logan Diggs), offensive guard (Maryland‘s Mason Lunsford), defensive end (Texas‘ Ovie Oghoufo), defensive tackle (West Virginia‘s Jordan Jefferson and Arizona‘s Paris Shand), inside linebacker (Oregon State‘s Omar Speights) and cornerback (Syracuse‘s Duce Chestnut and Ohio State‘s JK Johnson).

Combined with the No. 6 freshman recruiting class, that’s an awfully impressive roster upgrade. And it comes on the heels of on-field improvement too, as the Tigers jumped from a win-loss record of 6-7 and 39th in SP+ to 10-4 and 13th in Kelly’s debut. LSU is poised to take another step forward, and while Alabama is still the highest-ranked SEC West team here, the Bayou Bengals are within 2.7 points.

USC up three spots from 10th to seventh: Like his fellow second-year counterpart in Baton Rouge, USC’s Lincoln Riley hasn’t been shy about transfer portal usage, either. And after fielding absolute dreck on defense in 2022 (among a few other seasons in his head-coaching career), Riley has brought in both power-conference starters — Purdue end Jack Sullivan, Arizona tackle Kyon Barrs, Oklahoma State linebacker Mason Cobb, Arizona cornerback Christian Roland-Wallace — and a number of young, recent blue-chippers like former Georgia tackle Bear Alexander.

SP+ seems to feel a little better about the Trojans’ defensive prospects, projecting USC 39th on that side of the ball. (The Trojans were 46th in February.) Combined with a top-ranked offense, that should be enough to make USC the Pac-12 favorite.

Wisconsin up six spots from 25th to 19th: New head coach Luke Fickell is attempting quite the offensive identity shift in Madison, bringing in coordinator Phil Longo and three different transfer quarterbacks, led by SMU‘s 3,500-yard passer Tanner Mordecai. (Wisconsin quarterbacks to throw for over 3,000 yards in a season over the past 20 years? Only one: Russell Wilson hit 3,175 in 14 games in 2011.) The combination of portal work and an updated roster that included a few more returnees than I thought has bumped the Badgers up to 18th in returning production and 19th overall.


Brian Kelly has used the transfer portal to his advantage at LSU and pushed the Tigers up the SP+ charts. AP Photo/Tyler Kaufman

Georgia and the transfer gap

The transfer portal has made it a lot easier for teams — at least those pretty high up in the rankings — to add experienced players and field more complete teams. That’s not to say everyone uses the portal equally well, but now that I’ve had time to play with data from the transfer-heavy 2022 season, recruiting rankings for transfers have become a solid-sized piece of SP+ projections.

That means intriguing things for a team that (A) has won the past two national titles and (B) hasn’t dipped into the portal all that much.

Kirby Smart used the portal to add a couple of proven wide receivers (Missouri‘s Dominic Lovett and Mississippi State‘s Rara Thomas), a young running back (Tennessee‘s Len’Neth Whitehead, who carried 32 times in 2021) and a young cornerback (Texas A&M‘s Smoke Bouie, a Georgia native and top-70 recruit in 2021). Considering 25 teams have added at least 15 transfers and 53 have added at least 10, that’s not much of a haul in terms of either quantity or known production.

That has created an interesting effect. When it comes to the impact teams’ recruiting hauls will specifically have on their 2023 performance, Georgia’s class ranks just 22nd overall despite their freshman haul ranking second

2023 recruiting classes, ranked by potential 2023 impact:

1. LSU
2. Oklahoma
3. Oregon
4. Miami
5. Texas A&M
6. Florida
7. Ohio State
8. Auburn
9. USC
10. Michigan

Alabama’s transfer-light class ranks No. 11, and Georgia comes in just ahead of Wisconsin and Nebraska in the 20s. That’s not to say Smart is doing anything wrong; the Dawgs’ recent rings certainly say plenty about the recent product. But it does appear that, by choosing not to upgrade experience and production levels through transfers, the Dawgs are giving other teams an opportunity to catch up, at least slightly. SP+ still clearly likes UGA overall, but the gap might not be as big as we were initially thinking when the season ended.


Editor’s Picks

2 Related

When I posted my May SP+ update last year, I noted how completely and totally unprojectable teams like USC and LSU, with first-year coaches and blue-chip transfers, were going to be in 2022. Both the quantity and quality of the transfers they had pulled in were something I didn’t really have a way of accounting for in the projections. I assumed they would both overachieve projections, and they did exactly that.

With a year of transfer-heavy movement in the books, I’ve got something to work with, and I think I can better account for the player movement we continue to see. At least, I did think so until Deion Sanders took the Colorado job, booted most of last year’s roster to the curb and brought in 45 transfers (and counting).

Suddenly bringing in 20 transfers almost seems quaint.

The volume of Colorado’s player movement has made the Buffaloes this year’s “unprojectables.” SP+ currently projects them 103rd. It should be noted that this would be pretty significant improvement over 2022, when they went a dismal 1-11, with a No. 124 ranking. I’m fiddling with ways to account for the potentially wide variance of transfer-heavy teams — ways to make them more likely to see extreme results (good or bad) — but for now, this is what we’ve got. I would be surprised if the Buffs ended 2023 ranked lower than the 60s or 70s (or much higher than the 40s or 50s), but there’s really no way the math can account for the current levels of turnover.


Deion Sanders’ roster overhaul at Colorado makes the Buffalos hard to predict from an SP+ standpoint heading into the 2023 season. Ron Chenoy-USA TODAY Sports

Updated returning production

The Border War is back! Sort of. Missouri and Kansas haven’t played each other since 2011 — the Tigers’ last year in the Big 12 — but (A) the teams have scheduled a home-and-home series for 2025 and 2026, and (B) they’re currently fighting tooth and nail for the top ranking in 2023 returning production.

Since the SP+ projections above pull from returning production figures — numbers that do account for transfers by incorporating players’ FBS production at their previous school in both the numerator and denominator — I figured now was also a good time to include those updated numbers.

Current 2023 returning production rankings:

2023 returning production rankings

Team Ret Prod Off (Rk) Def (Rk)
1. Kansas 85% 91% (1) 79% (6)
2. Missouri 82% 80% (8) 83% (3)
3. N. Carolina 79% 84% (3) 74% (20)
4. Florida St. 79% 80% (9) 78% (11)
5. FAU 78% 68% (48) 88% (1)
6. Texas A&M 78% 77% (21) 79% (9)
7. Michigan 77% 75% (25) 80% (5)
8. S. Alabama 77% 78% (18) 76% (15)
9. UConn 76% 82% (6) 70% (31)
10. USC 76% 73% (31) 78% (10)
11. Auburn 74% 72% (34) 76% (14)
12. Boston Coll. 74% 79% (14) 70% (32)
13. Wyoming 74% 64% (61) 84% (2)
14. Toledo 73% 74% (29) 72% (24)
15. Syracuse 73% 74% (27) 72% (26)
16. LSU 73% 82% (7) 64% (58)
17. Temple 73% 70% (41) 76% (17)
18. Wisconsin 73% 77% (20) 68% (40)
19. Duke 72% 78% (15) 67% (45)
20. UCF 72% 69% (45) 75% (19)
21. Coastal Caro. 72% 78% (17) 65% (52)
22. Ohio 71% 84% (5) 59% (75)
23. Utah 71% 74% (26) 68% (41)
24. California 71% 63% (69) 79% (8)
25. JMU 71% 63% (70) 79% (7)
26. Washington 71% 72% (37) 70% (33)
27. Ole Miss 71% 80% (11) 62% (66)
28. Texas 70% 79% (13) 62% (65)
29. Rutgers 70% 65% (58) 76% (16)
30. NIU 70% 84% (4) 56% (81)
31. Sam Houston 70% 68% (49) 72% (25)
32. Vanderbilt 70% 74% (28) 66% (50)
33. UTSA 70% 73% (32) 66% (48)
34. Akron 69% 71% (39) 68% (42)
35. SJSU 69% 86% (2) 52% (93)
36. Miami 69% 65% (59) 73% (23)
37. UMass 69% 68% (51) 69% (35)
38. Ohio St. 68% 60% (81) 77% (12)
39. Oregon 68% 72% (36) 64% (59)
40. Miami-OH 68% 64% (67) 72% (27)
41. Rice 67% 68% (50) 67% (44)
42. Navy 67% 65% (57) 68% (39)
43. Texas Tech 67% 80% (10) 53% (89)
44. UCLA 67% 57% (88) 77% (13)
45. Clemson 67% 64% (65) 70% (34)
46. FIU 67% 64% (63) 69% (37)
47. Miss. St. 67% 79% (12) 54% (86)
48. Va. Tech 66% 70% (40) 62% (67)
49. Tennessee 65% 57% (87) 73% (22)
50. Oregon St. 64% 76% (23) 52% (92)
51. N. Texas 64% 72% (35) 56% (82)
52. Penn St. 64% 54% (97) 74% (21)
53. Iowa St. 64% 76% (24) 52% (96)
54. UNLV 64% 60% (77) 67% (43)
55. Kentucky 64% 69% (44) 58% (78)
56. Army 63% 62% (73) 64% (56)
57. UTEP 62% 64% (62) 61% (69)
58. Notre Dame 62% 55% (93) 69% (36)
59. Boise St. 62% 69% (46) 56% (83)
60. CMU 62% 44% (116) 80% (4)
61. NMSU 62% 76% (22) 48% (113)
62. Kansas St. 61% 73% (30) 49% (109)
63. Colorado St. 61% 61% (76) 62% (68)
64. Ga. Tech 61% 64% (66) 59% (76)
65. Oklahoma 61% 64% (64) 59% (77)
66. SDSU 61% 62% (72) 59% (74)
67. Louisville 61% 67% (53) 54% (87)
68. BYU 60% 57% (85) 64% (60)
69. Wash. St. 60% 70% (42) 51% (103)
70. Memphis 60% 69% (43) 50% (105)
71. Arizona 59% 77% (19) 41% (126)
72. Nevada 59% 52% (103) 66% (47)
73. Iowa 59% 63% (68) 55% (85)
74. Georgia 59% 52% (102) 66% (49)
75. Northwestern 59% 43% (118) 75% (18)
76. Maryland 59% 55% (92) 63% (63)
77. Ball St. 59% 53% (98) 64% (53)
78. Tulane 59% 71% (38) 46% (116)
79. BGSU 58% 62% (74) 55% (84)
80. Marshall 58% 66% (55) 51% (100)
81. Air Force 58% 47% (113) 70% (30)
82. S. Carolina 58% 66% (56) 50% (104)
83. Hawaii 58% 53% (100) 63% (61)
84. SMU 58% 52% (104) 64% (55)
85. Nebraska 58% 53% (99) 63% (62)
86. Illinois 58% 59% (83) 57% (80)
87. Arkansas 58% 55% (90) 60% (72)
88. MTSU 57% 44% (117) 71% (28)
89. So. Miss 57% 67% (54) 48% (111)
90. Baylor 57% 55% (94) 60% (73)
91. Fresno St. 57% 50% (108) 64% (54)
92. Oklahoma St. 57% 60% (78) 54% (88)
93. Arkansas St. 57% 51% (106) 62% (64)
94. Michigan St. 57% 48% (111) 65% (51)
95. Buffalo 57% 62% (75) 51% (99)
96. J’ville St. 56% 60% (80) 53% (90)
97. WKU 56% 69% (47) 43% (122)
98. TCU 56% 41% (123) 71% (29)
99. La. Tech 55% 62% (71) 48% (110)
100. EMU 55% 42% (120) 68% (38)
101. Ga. Southern 55% 58% (84) 52% (94)
102. Liberty 55% 64% (60) 46% (118)
103. Georgia St. 55% 57% (86) 52% (91)
104. NC St. 55% 60% (79) 50% (107)
105. USF 55% 43% (119) 67% (46)
106. Houston 54% 56% (89) 52% (95)
107. Purdue 53% 55% (91) 52% (98)
108. Minnesota 53% 55% (96) 52% (97)
109. New Mexico 53% 78% (16) 28% (132)
110. Louisiana 53% 67% (52) 38% (129)
111. Arizona St. 52% 59% (82) 46% (117)
112. Pittsburgh 51% 52% (101) 51% (102)
113. W. Virginia 51% 41% (121) 61% (70)
114. Wake Forest 51% 44% (115) 58% (79)
115. Virginia 51% 38% (124) 64% (57)
116. Troy 49% 55% (95) 44% (120)
117. UL-Monroe 49% 48% (110) 50% (106)
118. Florida 48% 51% (105) 45% (119)
119. WMU 48% 72% (33) 24% (133)
120. App. St. 47% 46% (114) 48% (112)
121. Indiana 46% 50% (107) 42% (124)
122. Alabama 46% 49% (109) 44% (121)
123. Charlotte 44% 27% (129) 61% (71)
124. Tulsa 43% 47% (112) 40% (127)
125. ODU 43% 35% (126) 51% (101)
126. Cincinnati 42% 34% (127) 49% (108)
127. Utah St. 41% 41% (122) 42% (125)
128. Texas St. 36% 27% (131) 46% (115)
129. Colorado 35% 37% (125) 34% (131)
130. Stanford 35% 27% (130) 43% (123)
131. UAB 33% 29% (128) 36% (130)
132. ECU 30% 21% (132) 39% (128)
133. Kent St. 29% 11% (133) 46% (114)

The Power 5 experience advantage

You can see a few teams with vastly different rankings than what I shared in February — teams like UTSA and Georgia State, which ended up returning far more seniors than I had been able to ascertain in the winter — but the most noteworthy thing about these numbers comes from conference averages.

Average returning production by conference:

1. SEC 65.1%
2. ACC 64.9%
3. Big 12 61.3%
4. Big Ten 61.1%
5. Pac-12 60.8%
6. Conference USA 60.1%
7. MAC 60.0%
8. Mountain West 59.8%
9. AAC 57.2%
10. Sun Belt 55.6%

It’s hard not to notice that the top five are all power conferences and the bottom five are, almost in reverse order, the conferences from which power-conference teams plucked quite a few stars in the spring transfer window.

If there’s a downside to current player movement, it’s this: While there’s nothing stopping Group of 5 teams from attempting to pluck stars from the FCS and Division II levels — and some are doing just that — we have seen quite a few Group of 5 veterans electing to take their chances and move up to the power-conference ranks.

Just take my AAC previews, for instance: (Part 1 here, and Part 2 here.) I wrote them in late-April — not that long ago! — and they included mentions of North Texas wide receiver Jyaire Shorter (who has since transferred to Auburn), UTSA wideout Zakhari Franklin (uncommitted but fielding Power 5 offers), East Carolina guard Nishad Strother (transferred to Oregon) and UAB safety Jaylen Key (transferred to Alabama), among others. That’s a pretty noticeable talent drain, and while it will probably impact the timing of my preview series in future seasons, it could also have quite an impact on the overall talent levels in the Group of 5 moving forward. We’ll see.

Sponsored Content

You Might Also Like

Top moments from Brady, Manning, Jordan and other athletes hosting ‘Saturday Night Live’

Rounding up athletes in Super Bowl LIX commercials: Beckham, Mahomes and the Mannings

FCS title game preview: Can North Dakota State knock off undefeated Montana State?

Doc to show tense Gastineau-Favre rift from ’23

BigP May 25, 2023
Share this Article
Facebook Twitter Email Print

Follow US

Find US on Social Medias
Facebook Like
Twitter Follow
Youtube Subscribe
Telegram Follow
newsletter featurednewsletter featured

Weekly Newsletter

Subscribe to our newsletter to get our newest articles instantly!

    Popular News
    Young won't throw at combine, other QBs will
    NFLSports News

    Young won’t throw at combine, other QBs will

    BigP BigP February 27, 2023
    From jerseys to dreadlocks: How the Pro Football Hall of Fame selects its artifacts
    Does the Ravens adding Odell Beckham Jr. send a message to Lamar Jackson?
    ‘Give him another chance!’: Patrick Mahomes trolls Travis Kelce for first pitch
    Facts vs. Feelings: Starts, sits and chasing that familiar feeling in Week 7
    - Advertisement -
    Ad imageAd image

    Categories

    • Sports

    About US

    We offer information and tips on US Sports and evernts all over the world.
    Top Categories
    • Game Analysis
    • Free Picks
    • Services
    • Premium Content

    Subscribe US

    Subscribe to our newsletter to get our newest articles instantly!

      © Foxiz News Network. Ruby Design Company. All Rights Reserved.

      Removed from reading list

      Undo
      Welcome Back!

      Sign in to your account

      Lost your password?